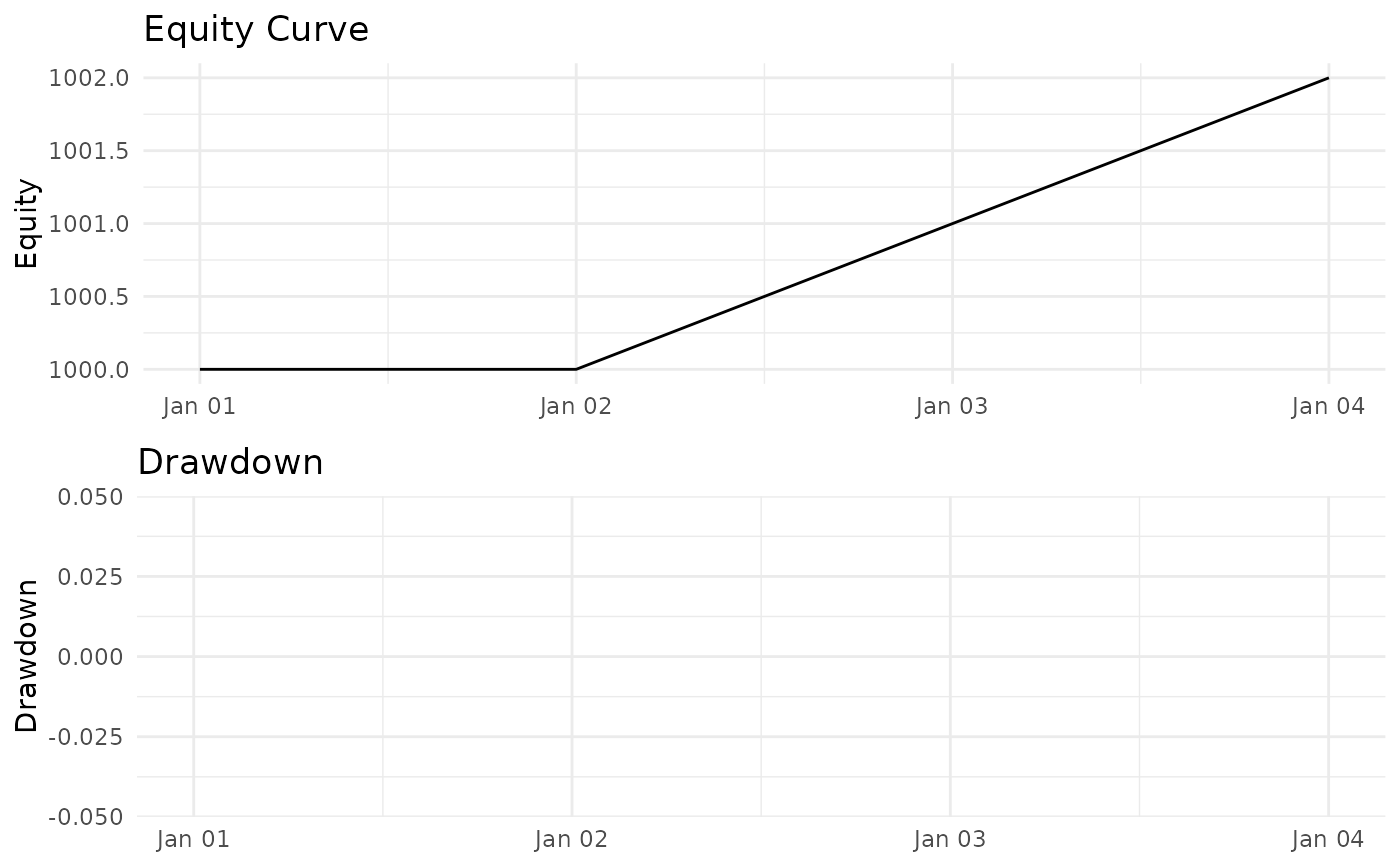
Plot backtest results
Usage
# S3 method for class 'ledgr_backtest'
plot(x, y = NULL, ..., type = "equity")Examples
bars <- data.frame(
  ts_utc = as.POSIXct("2020-01-01", tz = "UTC") + 86400 * 0:3,
  instrument_id = "AAA",
  open = c(100, 101, 102, 103),
  high = c(101, 102, 103, 104),
  low = c(99, 100, 101, 102),
  close = c(100, 101, 102, 103),
  volume = 1000
)
strategy <- function(ctx, params) {
  targets <- ctx$flat()
  targets["AAA"] <- 1
  targets
}
bt <- ledgr_backtest(data = bars, strategy = strategy, initial_cash = 1000, cost_model = ledgr_cost_zero())
if (requireNamespace("ggplot2", quietly = TRUE)) {
  plot(bt)
}

close(bt)